| |
In Massachusetts: Democratic, Unionized and Very Expensive
[1], I discussed the high costs of
transportation in Massachusetts, in particular the high cost and poor performance of the
Massachusetts Bay Transportation Authority (MBTA) or the T. Contributing to these high costs
ōis the stranglehold on state and local government by Massachusetts Democrats. In this state,
Democratic means liberal and liberal means government largesse at the expense of all state residents.
Another reason is the fact that {public employee} unions and the Democratic Party in Massachusetts
are joined at the hip. Democratic politicians in the state make sure that their union supporters are
taken care of legislatively, while the unions funnel their financial support back to the
Democratic politicians, campaign for them, and get out the vote for them. Everyone makes
out, everyone, that is except the poor slobs who end up paying the bills - the citizens
of Massachusetts who pay . . . higher than necessary public transportation costs . . .ö
(Ref. 1)
Most recently, another reason for the high cost of operating the T
emerged into public view ¢ the cost of early retirement coupled with generous retirement
payouts along with the cost of nepotism and political favoritism in the system. These abuses are
described in what follows.
Bloated T Retirement Benefits
ōThe Massachusetts Bay Transportation Authority on Thursday {8 August 2013}
released a list of nearly 6,400 names, many of whom are receiving pensions as a vestige of a
program that allowed employees to start collecting pensions after 23 years of service,
no matter their age. [Emphasis mine] That long-criticized system has {only recently}
been abolished and replaced by a program that allows employees to retire with a pension at age
55 with 25 years of service.
ōThe T's $1.77 billion retirement fund has long resisted making
the information public, saying it is a private trust, but a transportation finance bill passed in
July {of 2013} required that the information be released. [Emphasis mine]
ōCalls for release of the information increased as taxpayers have been
forced provide more to cover T pensions.ö (Ref. 2)
It turns out that the ōMBTA Retirement Fund has more pensioners scooping
up payouts than active workers paying into it.ö (Ref. 3)
In addition, ōmore than half of the 6,300-plus people receiving
pensions from the T retired before the age of 60, and 35 percent ¢ or 2,240 ¢ left before
55. . . . By comparison, the T has {only} roughly 6,200 active employees.
- - -
ōMeanwhile, taxpayer payments to the fund have soared in recent years,
topping out at $56.3 million last fiscal year, up from $30 million in fiscal 2007.
- - -
ōWith more people living to 85, or 90, theyÆre going to get a benefit
twice as long as they worked. . . . ThereÆs no question that this exceedingly generous benefit
is one of the factors in the TÆs financial problems.ö (Ref.
3)
So, whatÆs wrong with powerful public employee unions being in bed
with liberal politicians and with the lavish retirement benefits they obtain as a result?
Consider the following.
ōOut in California, the city governments of Stockton and San Bernardino
entered bankruptcy proceedings in 2012. - - -ö Why? ōPublic employee unions, legalized by Jerry
Brown in his first stint as governor 40 years ago, are strong in California, and in these two
cities, as in Vallejo, which went bankrupt in 2008, succeeded in getting lavish salaries,
health plans and pensions before the housing bust. - - - The California cities are
{in bankruptcy} primarily because of overbearing public employee unions.
ōTheyÆre probably not the last cities to go bankrupt for
these reasons.ö (Ref. 4)
Could what is happening in Stockton and San Bernardino happen
in Boston or in Massachusetts?
Cronyism on the T
In addition to providing generous pensions to retirees well before
normal retirement age, the T is also a haven for friends and relatives of well-positioned
politicians. William "Billy" Bulger was the Democratic President of the Massachusetts Senate.
He later served as president of the University of Massachusetts. Patrick Bulger, one of
William BulgerÆs sons, ōretired from the T in 2007 at age 43 ¢ remember, they only had to work
23 years to go out with the full boat. He now collects $55,546.42 a year.
ō- - - 43 is a little early to quit æworking,Æ so he immediately
began working on another kiss in the mail, at the Probation Department {another haven for
recipients of political favor}. It was a nationwide search ¢ his brother Chris {Bulger} . . .
was already there making $100,000.
ō- - - {Jackie Bulger, one of William BulgerÆs brothers}, was the
clerk of the Boston Juvenile Court and lost his pension after a conviction for obstruction
of Justice.
- - -
ō- - - Before he got to the courthouse, Jackie æworkedÆ at the T,
and his son {a nephew of William Bulger} followed him there. Mark Bulger retired in 2008
at the age of 43 with a pension of $34,732.44.
ōJackie has a daughter named Beth Zodda. She makes $65,000 on the
Senate payroll, where sheÆs been employed . . . ever since {her uncle} was president.
She has a husband, and until his retirement he toiled at {the T}.
ōRobert Zodda went out at age 55 in 2010 with $42,822.24 a year. - - -
- - -
ō{Double dipping is common among many of the TÆs retirees.}
Jim Rooney . . . took a small pay cut at the MCCA (Massachusetts Convention Center Authority}
from his $357,000 salary. Of course, he had a little something extra to keep him warm ¢ his
T pension of $62,541.24.
ōHe started collecting it in 1991, at age 41.
ōThis is the tip of the iceberg. - - - ō (Ref.
5)
Imagine being able to retire in oneÆs 40Æs with full retirement
benefits. I retired ōearlyö at age 65. Your children and mine will likely not be able to
retire until they are 70 or 75. Even Social Security has raised its payout age from 65 and it
is likely to raise it still more to 70 or 72 in the near future. But, remember that this is
Massachusetts: Democratic, Unionized and Very Expensive. ItÆs expensive only if you donÆt
have politically connected friends or relatives or you donÆt work for the state.
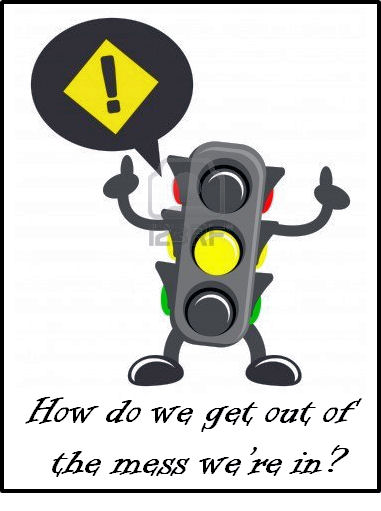
Cost-cutting and Bill-paying for Massachusetts Transportation
Transportation costs in Massachusetts are astronomically high and growing at
an alarming rate. The state is struggling to find additional revenue sources to meet these rising
costs. Some claim that a large part of the reason for these high transportation costs in
Massachusetts is a result of the high costs of operating the greater Boston MBTA public transit
system. That may be true. ItÆs a fact that ōspending on the MBTA has risen twice as fast as the
rate of inflation, and MBTA employees earn far more for the same work than their counterparts
in the private sector.ö (Ref. 6)
Another reason given for the stateÆs runaway public transportation
costs is ōthe stateÆs transit-related debtŚlargely because of borrowing undertaken for the
Central Artery Tunnel (Big Dig) Projectö. (Ref. 6)
For whatever reason, and, realistically, there are several reasons
for the stateÆs problems, there has been a major push-back to the ongoing clamor for more and
more money being thrown at the problem without a serious attempt to address the underlying
causes. This has even led to an open conflict between the Democratic leadership in MassachusettsÆ
House and Senate with the stateÆs Democratic governor. Public revulsion at the prospects of
still more taxes to pay for the stateÆs increasing transportation costs was expressed in a
Boston newspaper as follows:
ōWe spend more than almost anyone else, we raise spending year after
year and the only solution Massachusetts Democrats can come up with is æmore taxes, more spending?Æö
(Ref. 7)
Over the years, there has been lip service paid to coming up with
reforms to control the high transportation costs. ōTransportation reform . . . sought to
address {one} of the transportation systemÆs major cost drivers: labor costs, including
expenses from health care and other employee benefits, especially at the MBTA. Despite some
results, such as moving MBTA workers into the insurance plan covering state employees, wages
and benefits remain the transit systemÆs biggest cost. However, collective bargaining rules
and a process by which arbitration often reverses MBTA efforts to reduce costs limit the
agencyÆs ability to further control health care and pension costs.ö [Emphasis mine]
(Ref. 8) Such is the result of the unholy
alliance between the public employeesÆ unions and the stateÆs Democratic politicians
With reference to the most recent attempts to increase taxes, we
have the following: ōHere in Massachusetts, Beacon Hill Democrats want to stick us with a
massive half-billion-dollar (per year) tax hike, including a gas tax that will go up automatically.
ōThe good news is that {the stateÆs Democratic governor, Deval}
Patrick is outraged!
ōThe bad news? HeÆs outraged that itÆs not higher. HeÆs
demanding a minimum annual tax hike that grows to $800 million per year because ¢ he says ¢
our woefully underfunded transportation system needs it. - - -
- - -
ō- - - {Yet} without the LegislatureÆs tax increase or PatrickÆs turbo
tax ¢ weÆre already the third-highest spender in the country. [Emphasis mine]
- - -
ōUsing figures from 2009, the most current available for this level of
analysis, . . . our state Department of Transportation systemÆs costs are æwell above the
national average.Æ
ōÆMassachusetts ranks {3rd highest} in administrative costs per mile,
spending six times more than the national average. [Emphasis mine] And it ranks
{2nd highest} in total disbursements per mile, spending 4.4 times the national
average.Æ [Emphasis mine]
- - -
ō{For comparison, our neighboring state of} New Hampshire spends about $149,849
per mile of state road. ThatÆs maintenance, administration, everything.
ōMassachusetts? We spend $642,834 for that same mile of road ¢ half a million
dollars more per mile.ö (Ref. 7)
So we here in the Bay State spend more than 4 times what our neighbor to
the north does. And do Massachusetts drivers get better roads for the extra money being spent? I
seriously doubt it. In years past, I commuted on a daily basis to my work in southern New Hampshire.
I always knew when I crossed the border from Massachusetts into New Hampshire - the ride suddenly
became much smoother as a result of the better quality of the road surface and better maintenance
in New Hampshire. During our New England winters, the roads were always plowed better in New
Hampshire than in Massachusetts.
Politicians play at the game of reform when it comes to fixing the
transportation fiscal problems. But true reform is still a vain hope here in the Bay State.
The establishment - Democratic politicians and their public employee union co-conspirators ¢
are too firmly ensconced in power. Typical of the collusion between the public employee unions
and the stateÆs politicians is the charade of no longer requiring police details to act as flagmen
on road construction and repair in the state.
Massachusetts was the last state in the nation to approve the use of
civilian flaggers on its roads in 2008. But, the state regulation allowing the use of civilian
flagmen on road jobs is stacked in favor of police. ōCurrently only a handful of Bay State
communities, some of them with small police departments that donÆt have enough officers to
do details, use civilian flaggers on local street projects, according to a survey by The New
England Center for Investigative Reporting (NECIR). Four loopholes in the state regulation
have undercut the effort to replace police details with flagmen . . . . One is the provision
that requires police details on all roads where the speed limit is 45 mph {or higher} which ends up being
most major roads in the state. A second loopholeŚeach city and town police department can
insist that police details be used on road jobs for æpublic safetyÆ reasons. Critics say,
when that happens, the Massachusetts Department of Transportation (MassDOT) representative
on the job often gives police the final say. A third loophole allows cities and towns to
bypass the requirement to use flagmen on local road projects including work done by utility
companies. A fourth loophole pertains to police union contracts. If the contract requires
police details on all road jobs Śwhich most of the stateÆs big city police union contracts
doŚflagmen are not allowed if the city or town is paying for the project. . . . æThe hype
surrounding this reform has always been much greater than the reform itself'.
- - -
ōBecause the state regulation doesnÆt specifically require cities and
towns to use flagmen, the loopholes in the regulation have spawned an entitlement mindset among
officers who look to detail work as a way to increase their salaries. . . . æThere are some
real horror stories out thereÆ. . . . police officers stop trucks for inspection and run checks
on loads and employees while working on jobs where flaggers, rather than detail officers, are
used. æThey know how to get their point acrossÆ. . . . the concept of police details is so
engrained in cop culture, one Massachusetts police chief even torpedoed a state contract
because flaggers would be used in place of police details. This year alone {2011}, . . .{one}
Salem, NH firm bid on about 100 flagging jobs in Massachusetts but hasnÆt won a single job
yet.ö (Ref. 10)
Another reason for the transportation system woes in Massachusetts
is that the state has borrowed beyond its means to fund its transportation system infrastructure.
This is compounded by the fact that Massachusetts has ōthe highest business costs in the
nationöŚmostly driven by higher labor and energy costs, not taxesŚand an economy that is a
ōbelow-averageö performer compared to the nation as a whole. Because debt service is taking
45 percent of the budget that could be used for transportation, the outlook for the
transportation system is likely to continue to
deteriorate.[9]
It has been reported that the state agencies responsible for
public transportation ōare running structural deficits forcing quick fixes that do not
address the real problems. The systems are a wreck and the $15 billion to $19 billion
funding gap is real.
<
MBTA and Regional Transit Authorities
- Operating costs are not controlled, and the MBTA has not come close to meeting the 2000
Finance Plan goal of limiting growth of operating costs to 2.5% per year. Actual growth has
been 5% per year. The main culprits? MBTA retirement benefits (pensions and health care).
Retirees account for about one-half of the MBTA's health care costs, and two-thirds of the
retirees are under 65 (not eligible for Medicare).
- Sales tax revenue is inadequate: the 2000 Finance Plan assumed a conservative growth
in sales taxŚ3% per yearŚbut this has not happened. Since 20% of sales tax revenue goes
to the MBTA, this lack of growth is a problem.
- Debt burden is 25% of MBTA expenses. At $328 million (FY06), this is more than the
MBTA took in in fares in 2006.
- State of Good RepairŚdefined as capital assets functioning at intended capacity
within their design lifeŚcannot be achieved because the MBTA has not generated a
surplus (est. $67 million in FY07) to fund improvements.
- The 15 Regional Transit Authorities routinely borrow to pay operating expenses.
MassHighway
- Staffing is inadequate, down from 3,000 to 1,740. The Federal Highway Administration
declared this "well below the minimum needed to fulfill the necessary construction...
functions."
- 82% of staff and 65% of MassHighway operations are paid from the capital, not operating,
budget (2006).
- 44% of Massachusetts' highway funds go to paying debt service, the highest in the nation.
- 25% of money expected from the Federal government for highway spending between FY07¢09
will go to repay notes issued for the Central Artery/Tunnel project (CA/T).
MassPike {The Massachusetts Turnpike Authority}
- MassPike's problems started when the state went to MassPike to cover a big part of the CA/T.
MassPike is paying $1.8 billion of CA/T cost, about $1.4 billion funded through debt.
- The state committed existing fundingŚa portion of license and Registry feesŚbut no new sources.
- The CA/T operating and maintenance costs over time will exceed the $25 million per year given to
MassPike by the state.
- Toll discounts exacerbate MassPike's problems. FAST LANE alone costs $12 million per
year.ö (Ref. 11)
In Summary
Transportation costs in Massachusetts are among the highest in the
United States. That would not be so bad if the return on the taxpayerÆs investment was
commensurately high. Unfortunately, the opposite is true ¢ road maintenance is not better
than in other states and MBTA public transit maintenance is also poorer than elsewhere. So
what do our state politicians propose to do about the problem? The stateÆs Democratic governor
proposes to continue on the same path that has gotten Massachusetts into its current bind ¢ throw
more money at the problem and levy more taxes on the citizens of the state. And what are the
citizens of Massachusetts doing about correcting the situation? We, the supposedly highly educated
citizenry continue to elect and re-elect the same politicians who belong to the same political
party that has helped to create the mess. Massachusetts needs a new set of players with a fresh
outlook who will be serious about tackling the high costs of transportation in the state. More of
the same-old-same-old wonÆt hack it! Ultimately, there is only one group to blame for MassachusettsÆ
transportation woes. That blame rests squarely on our shoulders, the shoulders of the
Massachusetts voters who refuse to take the steps necessary to throw the bums out of office
who have contributed to the creation and the continuation of the mess. It rests on our shoulders,
the shoulders of the citizenry of Massachusetts who ignore the collusion between public employee
unions and politicians. It rests on our shoulders, the shoulders of the Massachusetts taxpayers
who continue to shell out exorbitant amounts of money without getting the service we deserve in
return. It rests on our shoulders, the shoulders of the obedient monkeys of Massachusetts who
hear no evil, see no evil and speak no evil.
Where is the Sam Adams of the 21st century? Sam Adams of the 18th century
was a rebel, a rabble-rouser, a revolutionary agitator, one of the founding fathers of these United
States, a true Son of Liberty, and an eminent 18th century Bostonian and Bay Stater. Today, he
must today be turning over in his grave to witness the passivity and lack of intestinal fortitude
on the part of the current citizens of Massachusetts. Alas, while we continue to celebrate the Boston
Tea Party of 1773, we do not possess the gumption to participate in another one today.
--------------------------------------------------------------------------------------
References:
- Massachusetts: Democratic, Unionized and Very Expensive, David Burton, Sonofeliyahu.com;
Article 168, 2 July 2013.
- MBTA releases long-closed pension data, wxvb.com, 9 August 2013.
- More T pensioners collecting than paying, Matt Stout, Boston Herald, Page 2,
10 August 2013.
- Detroit wonÆt be last city to go belly up, Michael Barone, Boston Herald,
Page 21, 13 August 2013.
- T pension list a map of Bulger famÆs free rides, Howie Carr,Boston Herald,
Page 4, 9 August 2013.
- Transportation in Massachusetts: The Cost of Doing Nothing, The Boston Foundation,
11 April 2012.
- Mass. Tax-and-spend road $how, Michael Graham, Boston Herald, Page 15,
5 July 2013.
- MAXED OUT: MASSACHUSETTS TRANSPORTATION AT A FINANCING CROSSROAD, Transportation
for Massachusetts (T4MA), October 2011.
- Transportation in Massachusetts: The Cost of Doing Nothing, tBf: The Boston
Foundation, 11 April 2012.
- Flagmen Vs. Police Details: Taxpayers Footing the Bill, Beverly Ford, New England
Center for Investigative Reporting, 25 September 2011.
- The State of Transportation in Massachusetts,
http://www.macponline.org/PDF/Boston%20Informer%20TransReform.pdf,
Accessed 13 August 2013.
|
|